Maps and Visualization
Throughout my education and professional experience, I have developed proficiency in GIS (Geo Information Services) and architectural tools, which come to use in creating visualizations, plans, and maps. This mix allows me to bridge two worlds: the technical and the aesthetic.
Here are some examples of my work.
-
Map of Morava
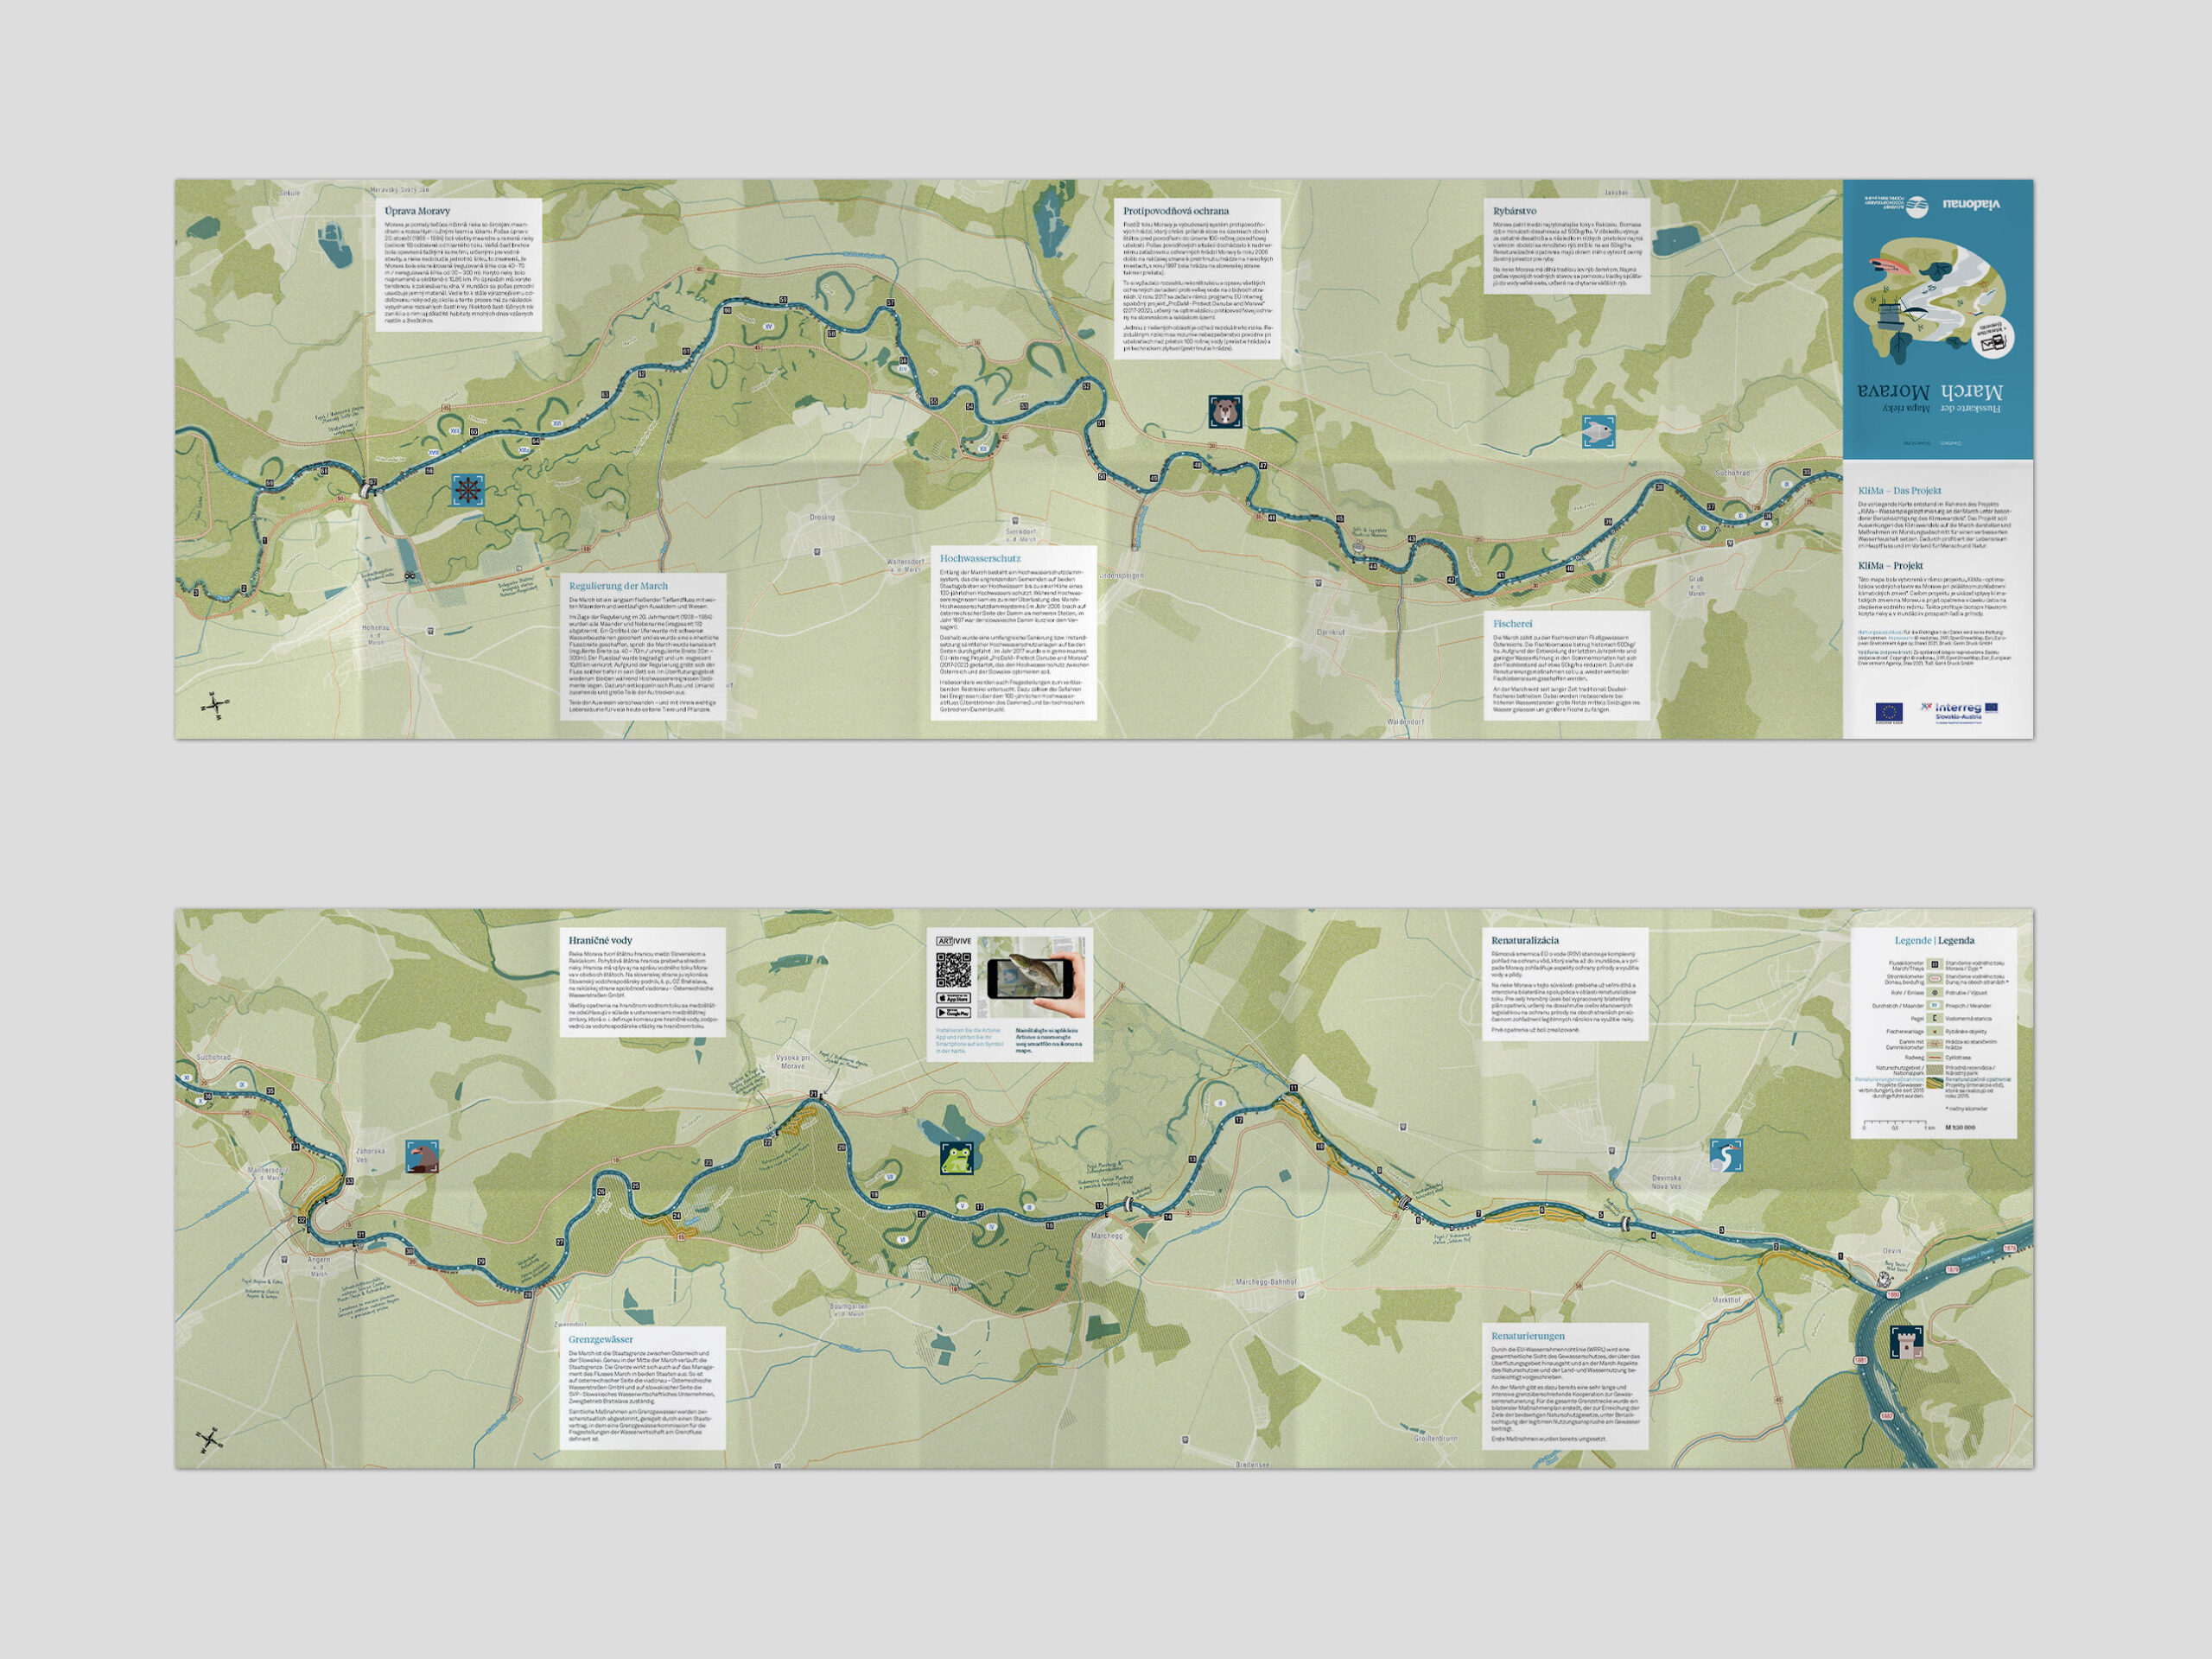
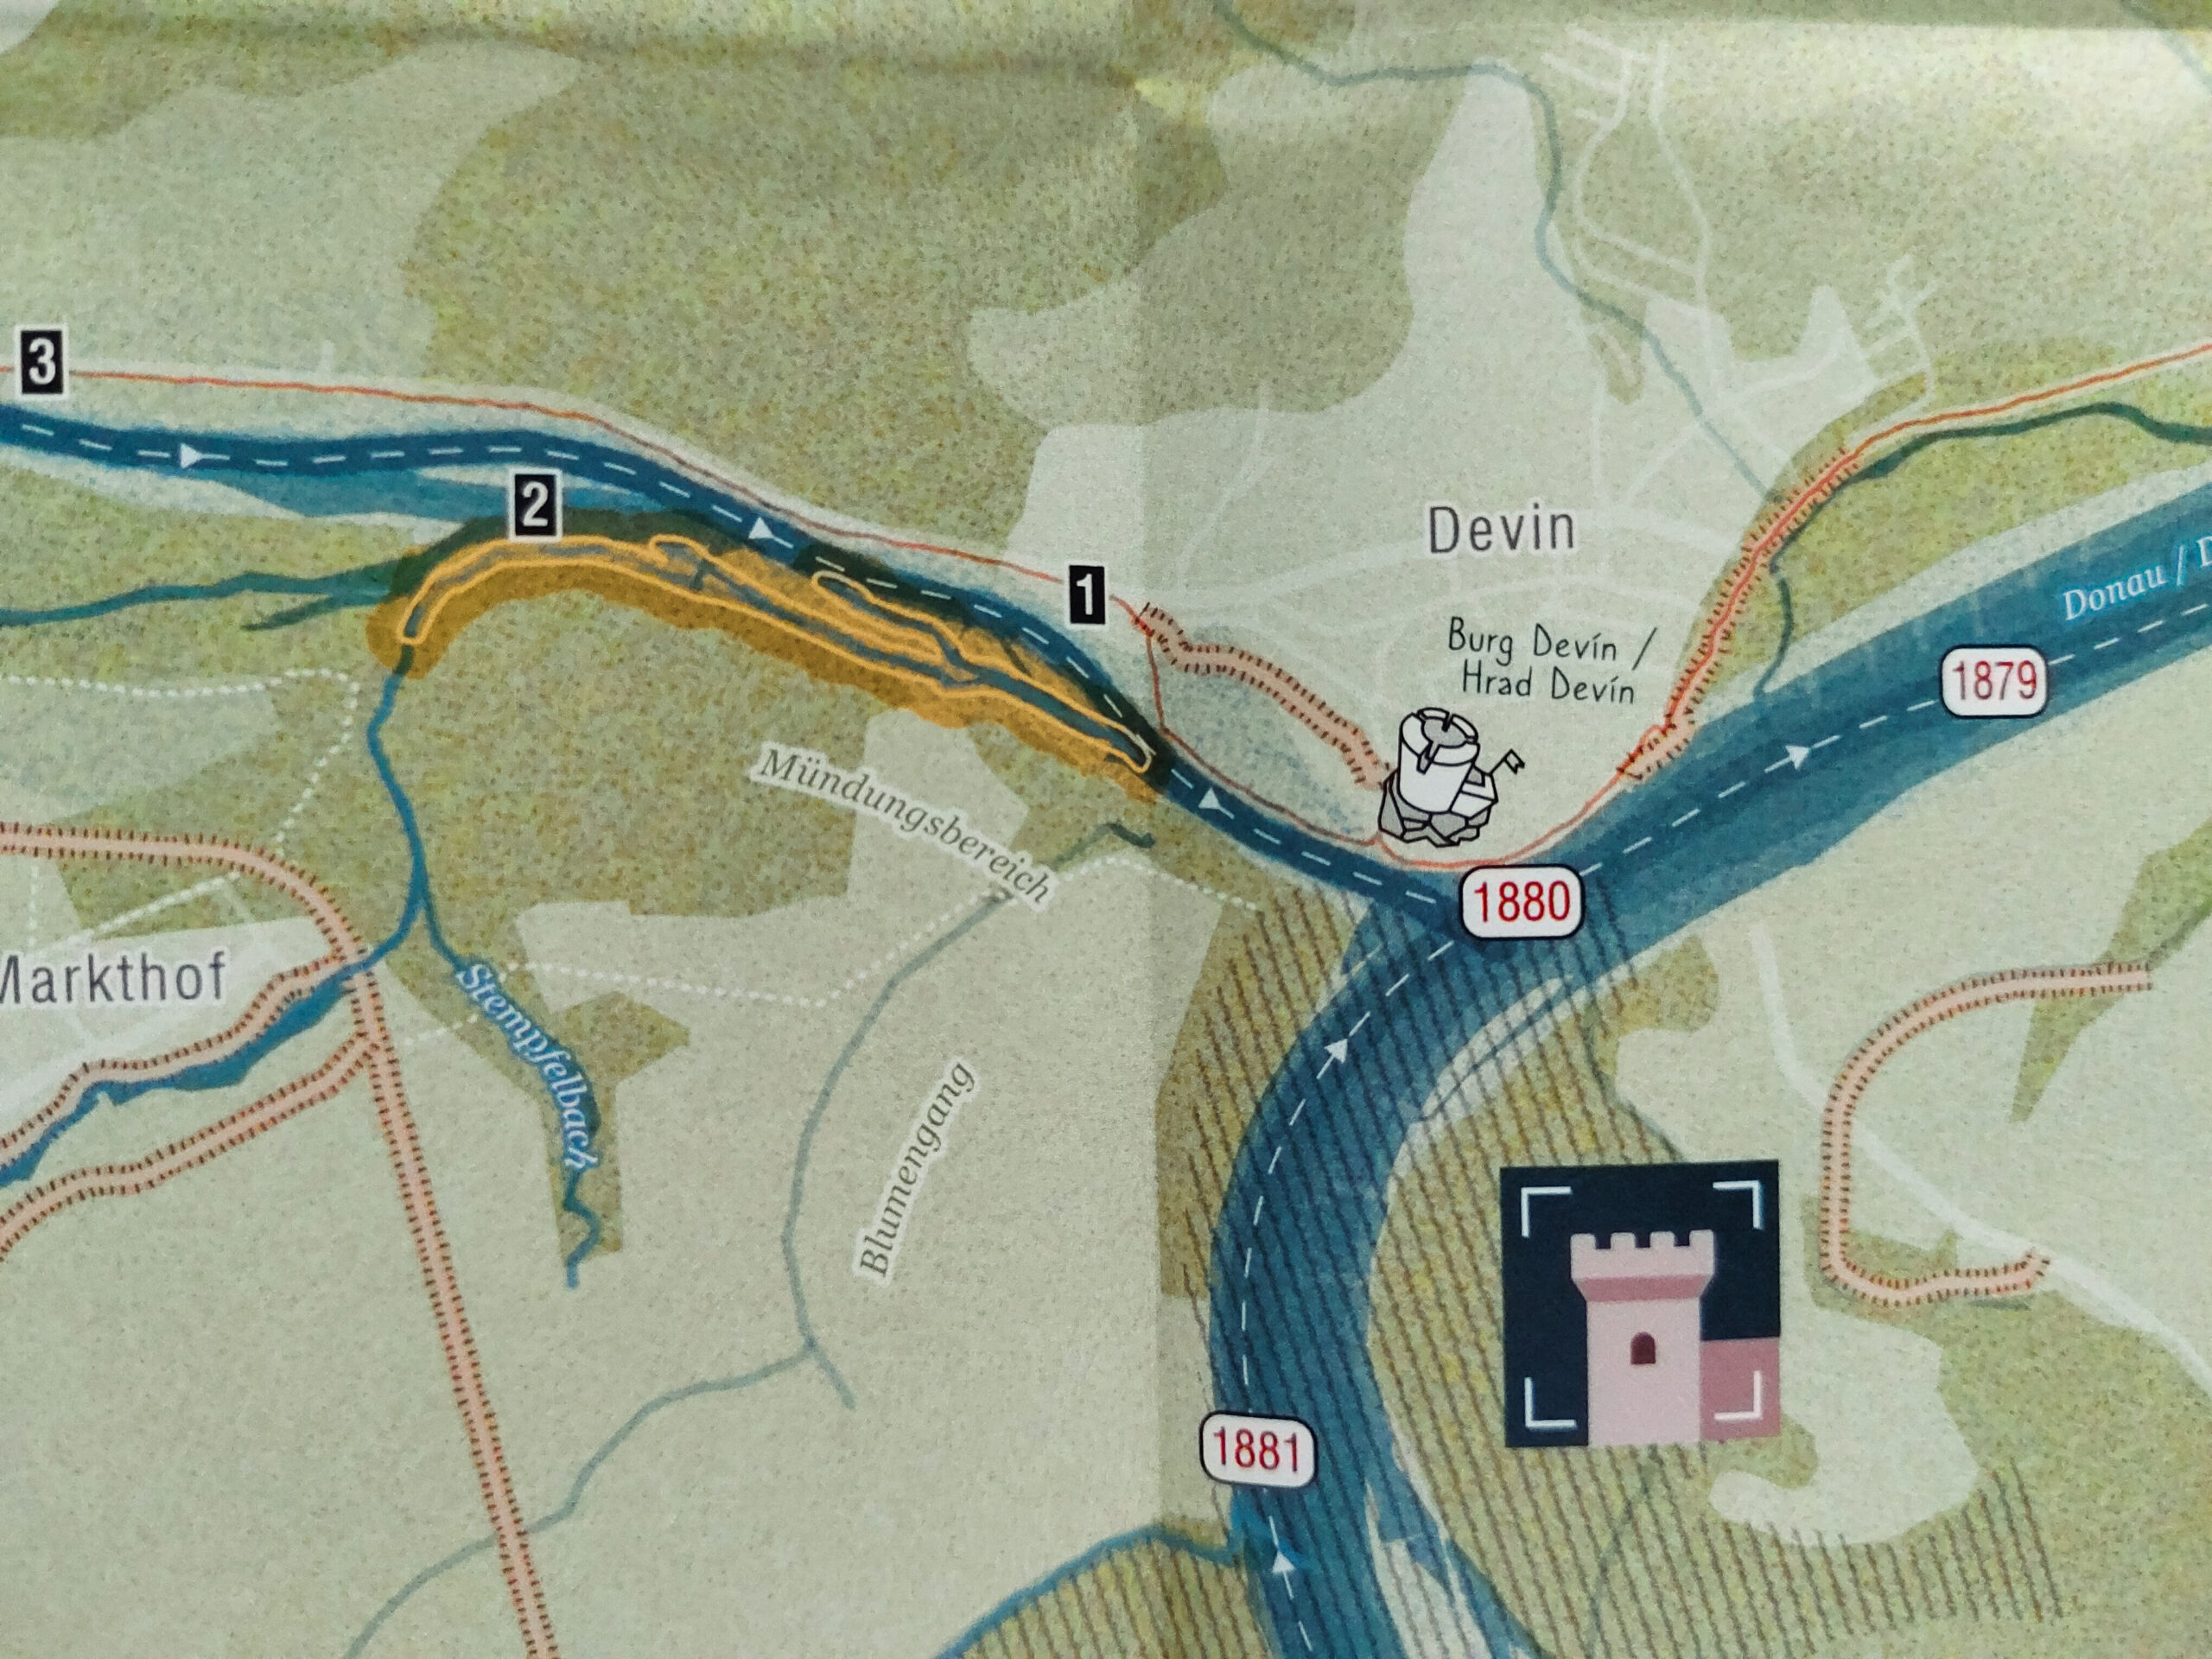
The overview map of the March/Morava River for hikers and paddlers features the entire river course, including water management structures and restoration projects, which are presented on both sides of the fold-out map. The projects are explained in accompanying text boxes.
To ensure durability against water damage, the map is printed on innovative stone paper, which eliminates the need for coatings while providing a pleasantly lightweight texture.
Since the March River serves as the border between Austria and Slovakia, all texts are presented in both languages.VR Elements
As an added feature, the map includes a VR experience. Using an app, users can scan designated locations with their smartphones to access additional audio-visual content.

-
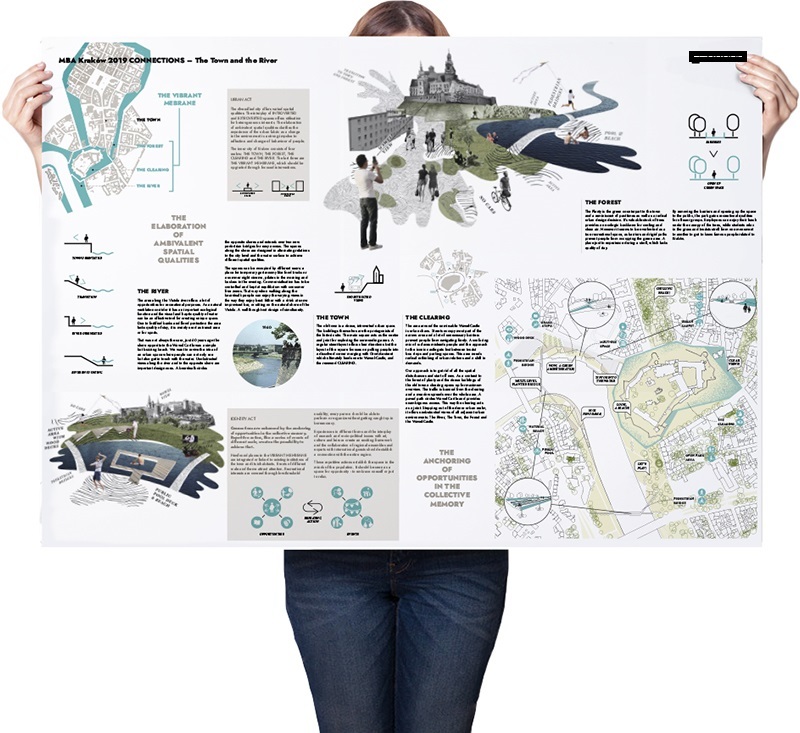
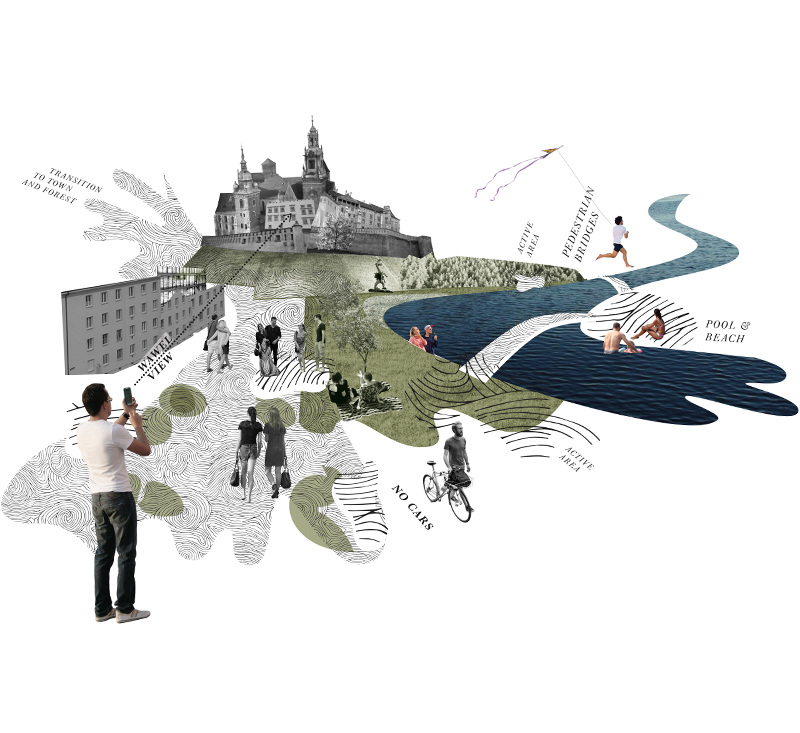
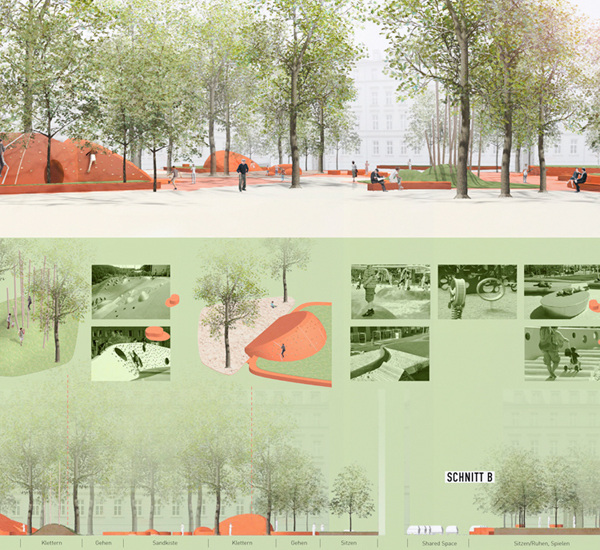
Inclusive Urbanism:
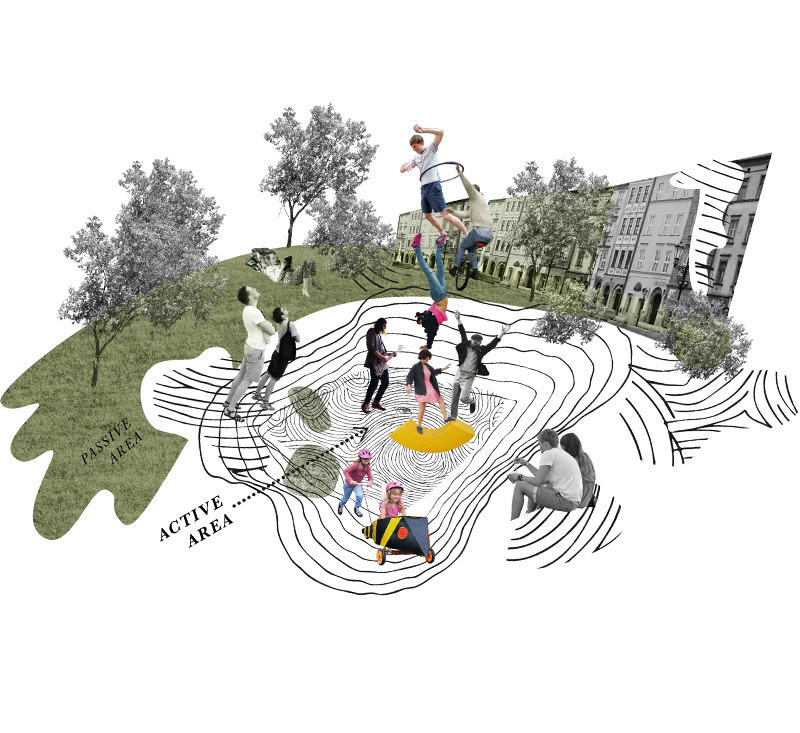
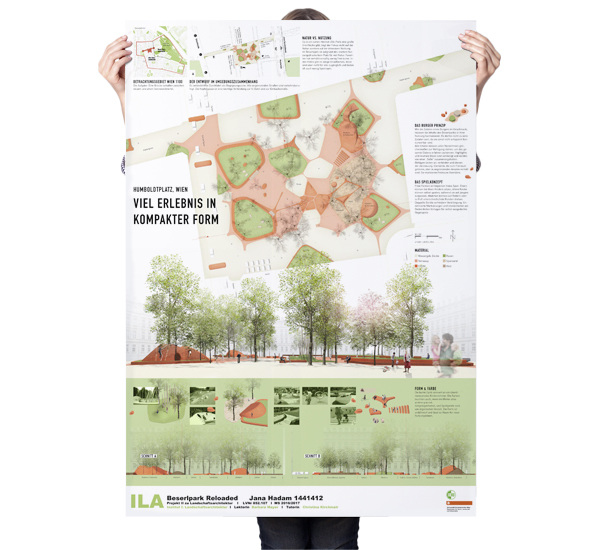
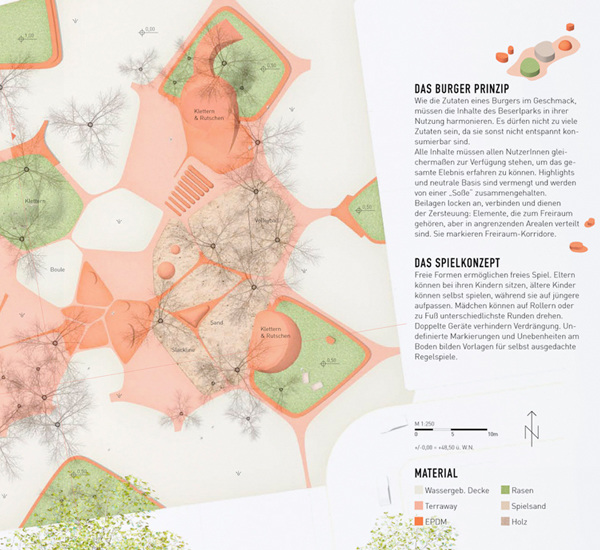
Redesigning Keplerplatz, ViennaThis solo project addresses the urban density of Vienna’s 10th district by connecting a problematic neighborhood with a modern, green quarter. The design focuses on transforming car-heavy streets into pedestrian-friendly zones while significantly improving the quality of public space.
A central challenge was the redesign of Keplerplatz. Instead of a complete clearing, my concept prioritized the preservation of all existing mature trees, integrating them into a new, gender-sensitive spatial layout. By rearranging the surrounding infrastructure and removing car traffic, the design creates a safer, more inclusive environment without losing the ecological value of the established greenery.
This work was recognized as one of the ten best projects at a university vernissage. Its emphasis on sustainable urban cooling and social equity mirrors the direction of recent real-world renovations in the Favoriten district.
-
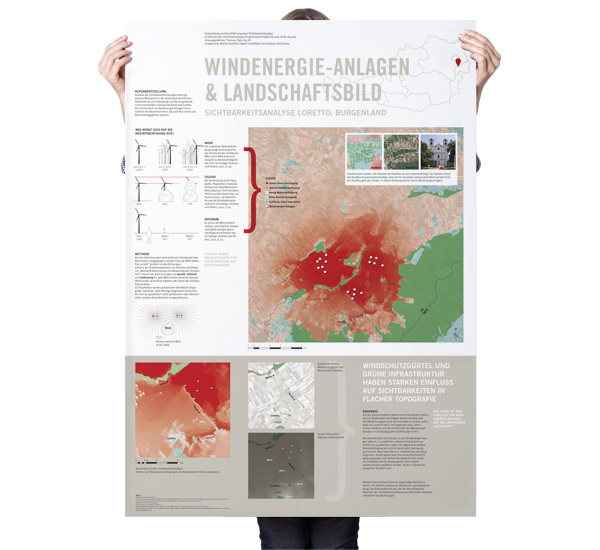
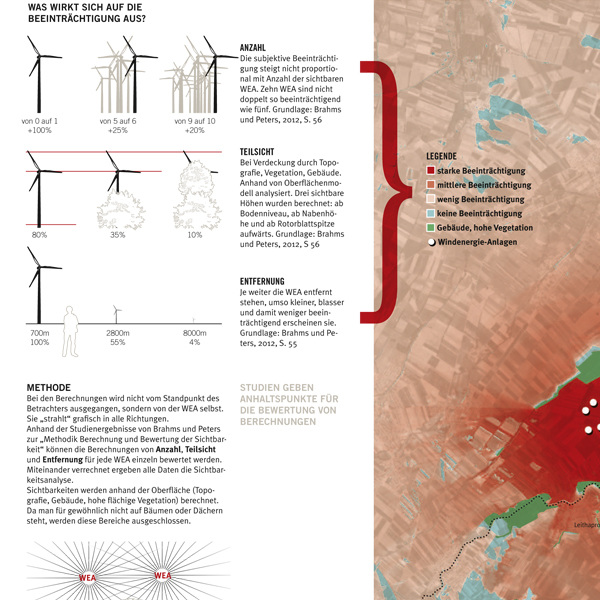
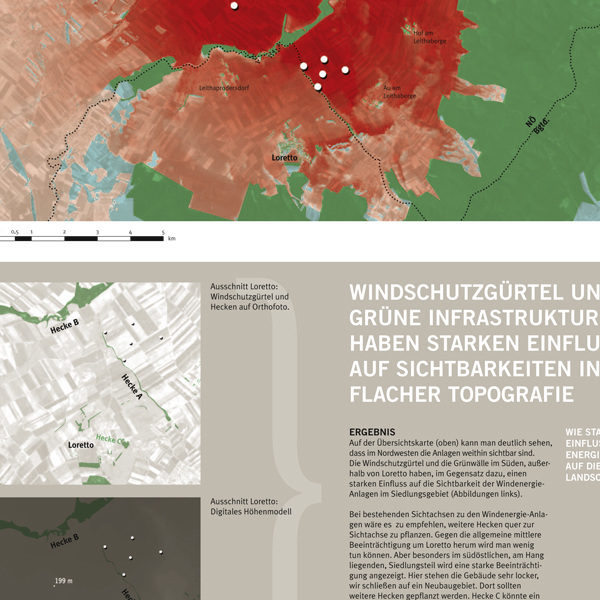
GIS-Based Viewshed Analysis & Methodology
This project involved conducting a technical visibility study for wind energy plants using ArcGIS. Beyond the spatial analysis, I focused on the visual communication of the process. I developed a presentation poster that uses infographics and detailed documentation to explain the technical steps and data sources. This approach ensures that the analysis is methodologically sound and easy to follow.